My Day Trading Screen Setup
Read Time: 5 Minutes
This week, I'm taking you straight into the heart of my trading space – my screen setup. It's where all my trading action happens. I'll show you the charts I use and explain how each one guides my decisions. It's a simple setup that helps me stay focused and informed.
My Computer Monitors
First, let's talk about computer monitors. I have two monitors on my desk, but one of them is a 49" ultrawide monitor that allows me to have three windows open side-by-side. So, in total, I have enough screen space for four full-size windows. Here's how I fill up all that screen space:
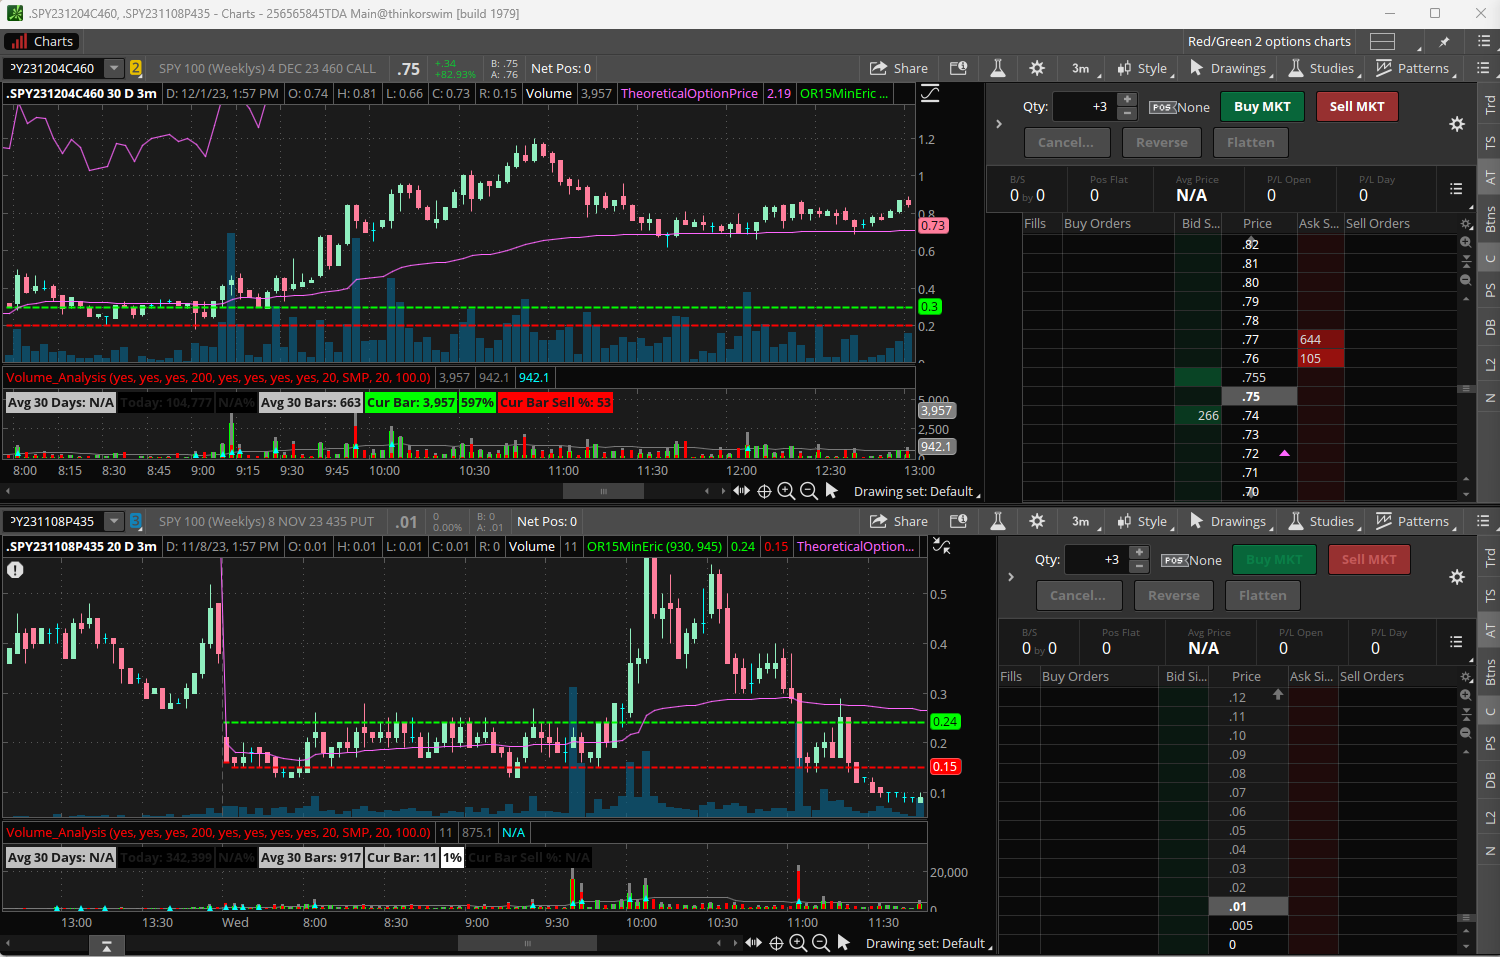
Window #1: My Option Charts
In my first window, I have two option charts stacked vertically, with ActiveTrader pulled up for each. This is the window where I place all of my trades. Typically, the current at-the-money (ATM) call option chart is on the top half of this window, with the ATM put option below. I use these charts to help identify my target entries, profit targets, and stop losses.
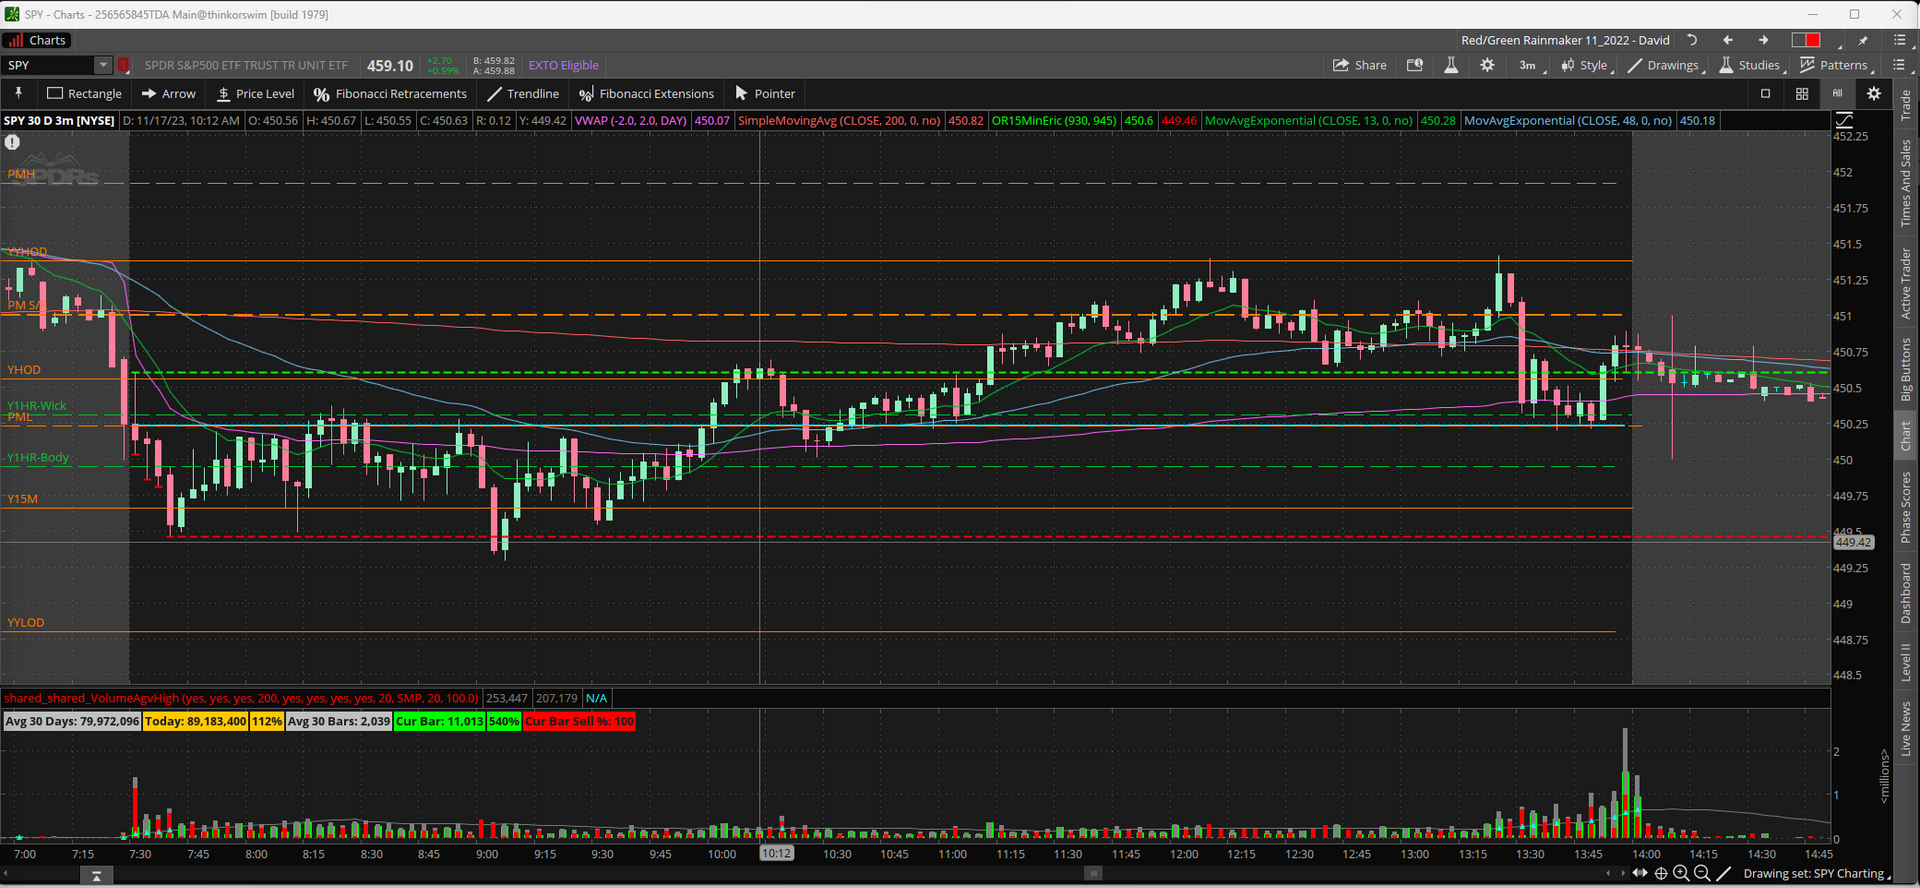
Window #2: My Primary $SPY Chart
This is the window that is directly in front of me and it's the primary chart that I use to read $SPY price action. As you can see, this chart is marked up with all of my key levels, trendlines, and indicators. Many traders would argue that I have too many lines on this chart but it works for me because I've developed a system that helps me focus on only the most important lines and levels.
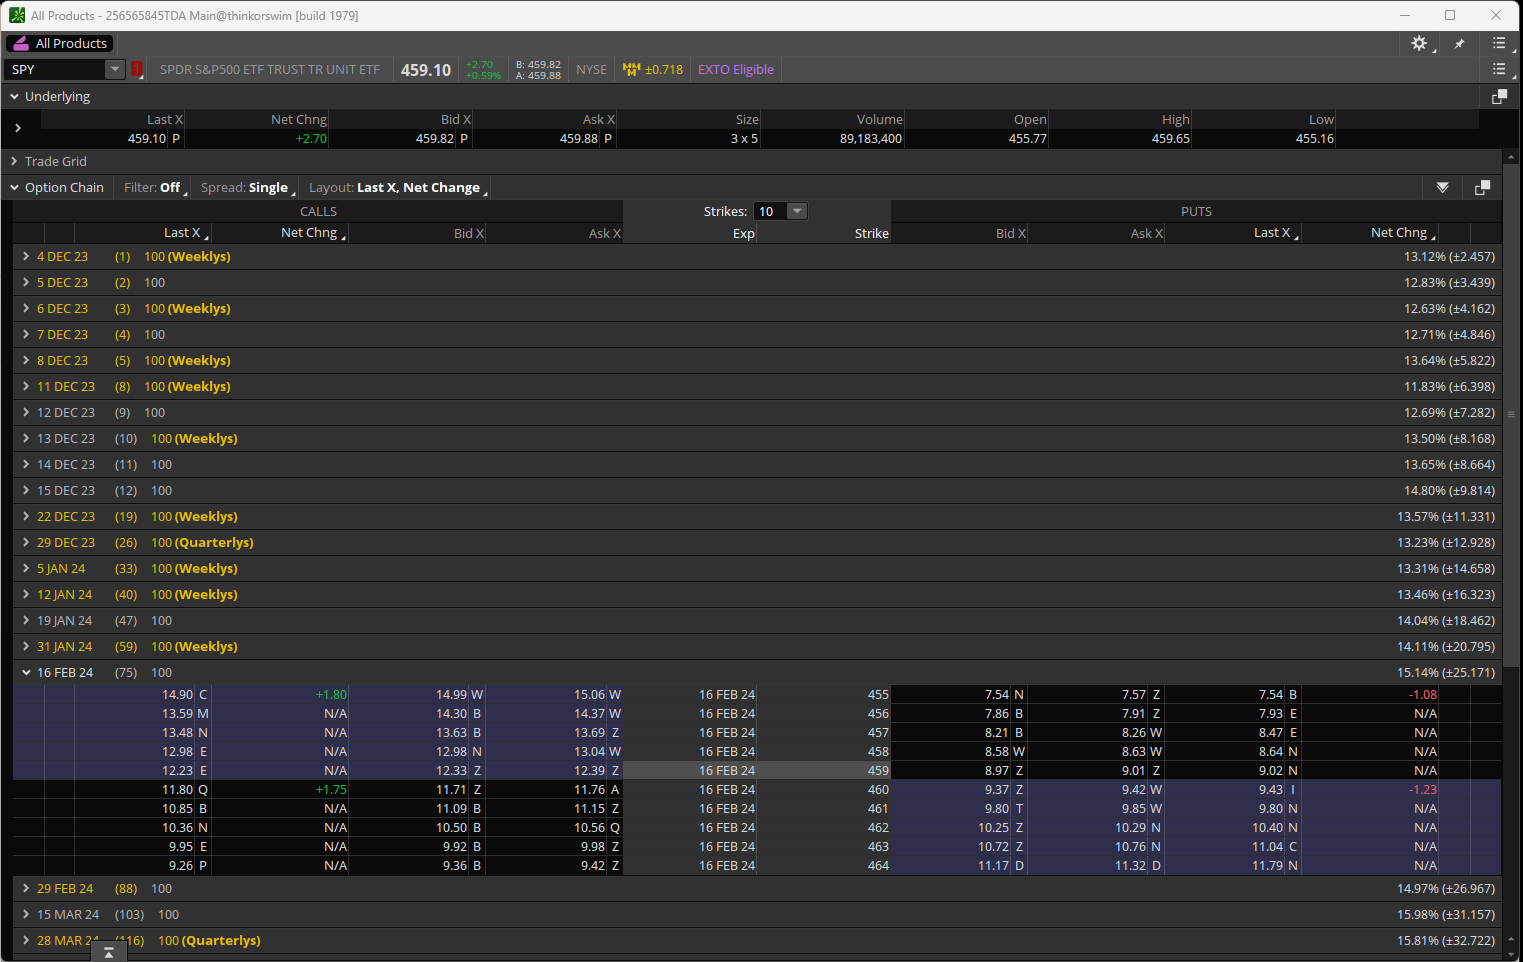
Window #3: Rotating Window
I use this window to flip between different things. In the morning, I have a web browser pulled up to review market news and upcoming economic reports. Once the market opens, I'll flip between the general Option Chain in ThinkorSwim and my favorite Trading Discord. On slow days, I may also use this window to catch up on emails or other work-related tasks while keeping an eye on the charts.
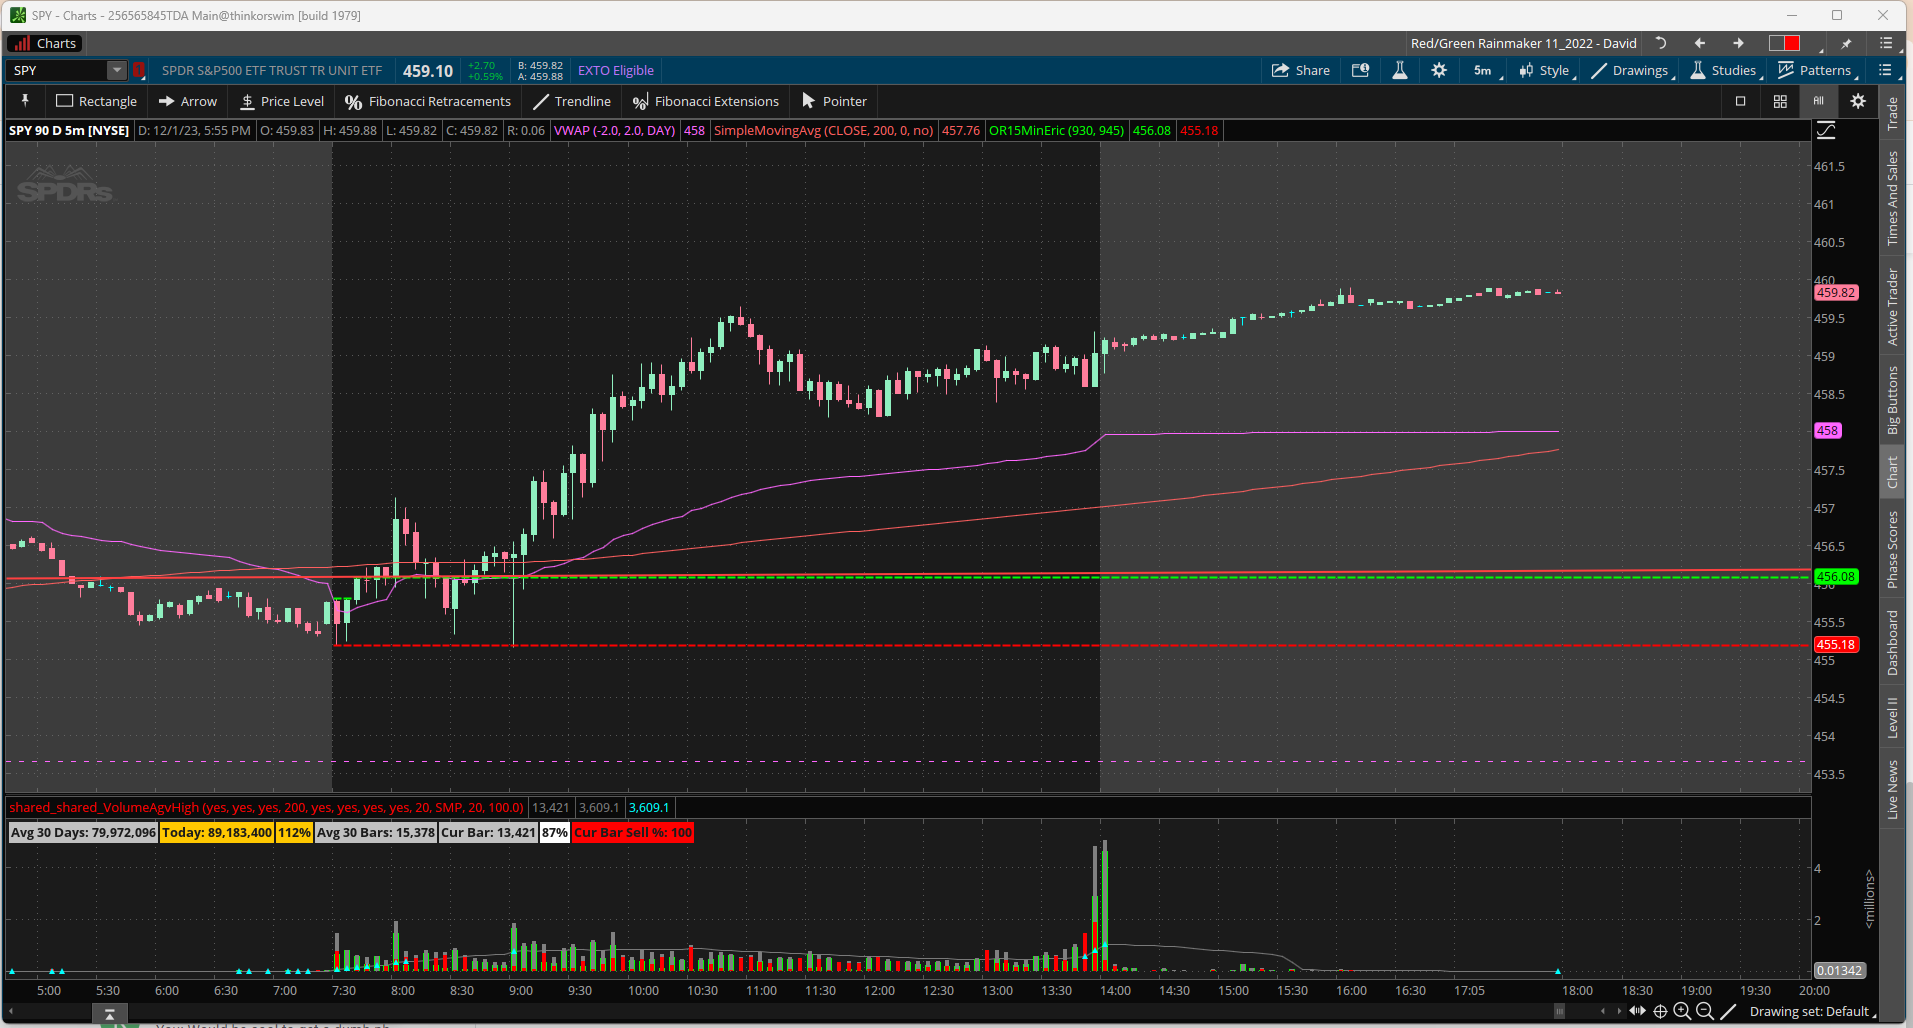
Window #4: My Simplified $SPY Chart
This is a new addition to my trading setup but has become an integral part of my system. On this window, I have my simplified $SPY chart. Unlike my "busy" primary $SPY chart, this one has just one indicator (VWAP) and very few levels or trendlines drawn on it. Most days, it'll just have 1-3 major levels or trendlines and nothing else. I like to use this chart for spotting higher time frame support/resistance levels and trendlines. I've also started to use this chart more for reading intraday price action.
Bonus Space: My Watchlist Charts
At the bottom part of my 49" monitor, I have a strip of screen real estate that is home to my watchlist charts. My watchlist charts include $VIX, $UVXY, $AAPL, $IWM, $QQQ, $SPY 15M , $SPY 5M, and then one extra space that I use to swap between other useful charts such as $XLF, $MSFT, and /ES. I can go more into how I use my watchlist charts another day, but I keep an eye on these specific charts because many times they will provide valuable clues about how $SPY will move. For example, seeing my volatility charts (VIX & UVXY) suddenly start dumping would lead me to believe that $SPY could be ready to make a move up because a decrease in volatility generally indicates upcoming market strength.

That's a wrap on my screen setup tour! Remember, what works for me might not be the perfect fit for you. The key is to experiment with different screen setups until you find the one that feels right and enhances your trading efficiency.
Have a great week ahead,
Eric
Join the Day Trading Inner Circle
Follow along as I strive to become a profitable day trader. Every Sunday, I send out an email with my weekly trading stats plus the most important learning resources that I discovered that week. Drop your email in the box below to join the inner circle.
Home Newsletter Signup
Previous Issues of Side Hustle Steroids
